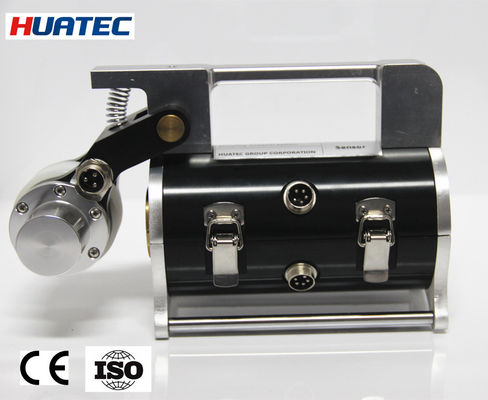
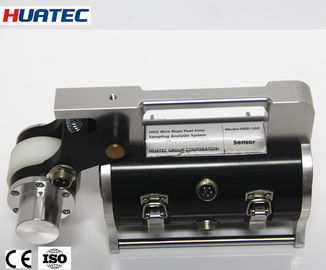
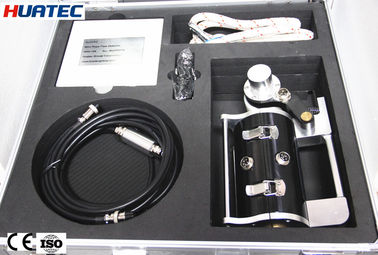
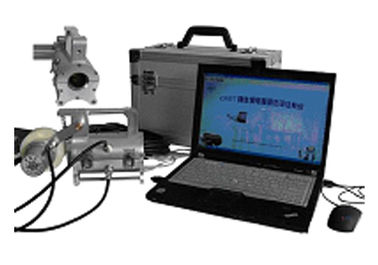
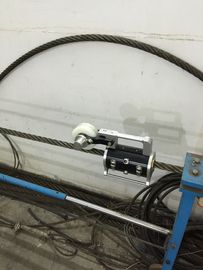
WRT Magnetic Rope Detector Steel Rope Wire Rope Internal External Flaw Detector HRD-100
1. Specifications
Standards: GB/T21837-2008, ASTM E1571-2001 (Standard specification for electromagnetic examination of ferromagnetic steel wire rope), GB/T5972-2006/ISO 4309:90, GB8918—2006
Detecting range:Φ1.5—300 mm (choose different sensor)
Relative velocity between sensor and wire rope:0.0—6.0 m/s Best choice:0.3—1.5 m/s
Best gap between guide sleeve and wire rope: 2—6 mm,allowed gap:0—15mm
Output file type: Word files output
Alarm: Sound and light alarm
Broken wire rope location(LF)detection
Qualitative judgement accuracy: 99.99%
Quantitative assessment
Repeatability error of Sensitivity: ±0.055%
Display error: ±0.2%
Error of location detection,(L): ±0.2%
Power:5V computer power supply
WEIGHT OF SENSOR: < 10kg (Regular sensor)
Environment temp.-10℃~40℃
Air pressure:86~106Kpa
Relativity humidity:≤85%
The windows system of wire rope computer detector is the GB system renewal product which based on the DOS software theory and the real time display alarm guiding ideology utilizes Visual Basic6.0 the programming language foundation, carries on the compilation to become.
This system hardware part uses the domestic and foreign advanced magnetic sensor and the independent research and development sampling module unifies, through RS232 (or USB) main line driving, directly storage data in computer.
This system software part is in the wavelet transformation analysis foundation, in utilizing Visual Basic 6.0 programming language foundation, carries on the compilation to become. Achieve the functions such as data acquisition and control, data analysis, data display, data storage and so on. Increase the visible characteristic in the DOS software function, and by its unique tendency continuously to track the way, may continuously, the dynamic observed data signal and its the change situation, and the real time display obtained result and sends out the alarm; Software increased the automatic evaluation function; In the partial flaw demonstrated on increased cross section and the total sectional area percentage; Software and Windows are completely compatible, suits to user's inertia operation, uses the Word files form production examination report.
This system software may compatible wire rope computer detector DOS software sampling data format, and can analysis processing to it.
The windows system took an independent operating procedure and the safe examination system, can conveniently be suitable for each kind of modern computer, and completes a series of examinations procedure.
2. Systems Demand
2.1 Computers Hardware Disposition Demand:
Processor: Above Celeron 1.5GHZ
Memory: 128MB
Hard disk: 10G
Connection: RS232 or USB
Monitor: Above VGA
2.2 Software Environment Demand:
- This system supports the Windows XP, Windows 7, Linux etc operating system;
- Need install Microsoft office word platform.
2.3 System Disposition
| Magnetic sensor (including distance locator) |
A group |
| HUATEC HRD-100 real-time alarm apparatus |
One |
| Signal connection line |
One |
| RS232 transmission line (or USB to RS232 transformation line) |
One |
| windows special-purpose software package |
One |
| Computer |
One |

3. Sensor introduction
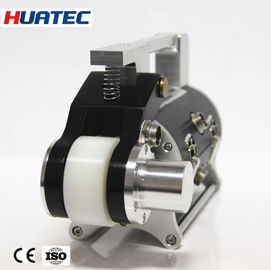
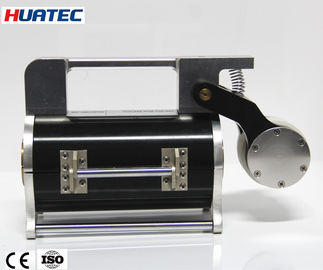
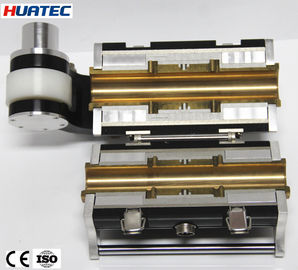
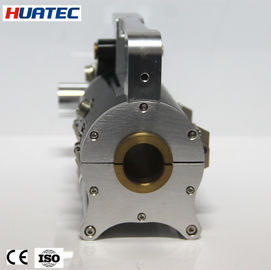
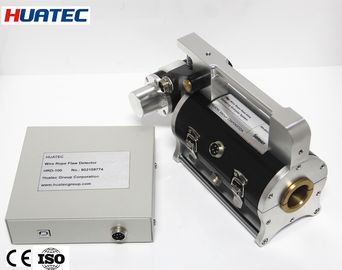
Magnetic sensor: The sensor is composed by displacement locator (Leading wheel, encoder), the magnetization installation and the sampling organization. After the system activated, the wire rope and it has the relative movement, then it can gather the signal.
Displacement locator: Leading wheel rotated a circle, the photoelectric encoder sends out the sampling instruction pulse, realizing equal space sampling.
Magnetization installation: When the wire rope and it has the relative movement, completes to the wire rope axial magnetization.
Sampling organization: When the wire rope and the sensor have the relative movement, the Hall element composed the sampling channel will transform the wire rope magnetic flux leakage change condition into the simulation voltage signal.
4. HUATEC real-time alarm apparatus
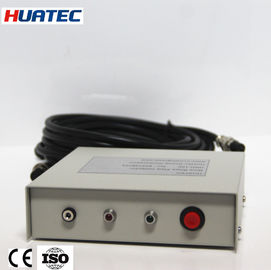
The HUATEC real-time alarm apparatus is a portable multi-purpose data acquisition, through the RS232 transmission line to send and save the converted data signal to the computer, make use of the computer CPU formidable function on-line and real-time processing analysis, according to the equivalent threshold value which will set in advance sends out the real-time alarm. One group to give the sensor power supply lithium battery group, the output is 5V. There is an addition charge port to be possible to supply the charge and the power switch.

Picture 2 Signal Sampling Wiring Diagram
5. Software introduction

Picture 3 Main Functions Items

Picture 8 Parameter Settings
6. Broken wire analysis
Broken wire analysis (Ctrl+N) is the man-machine dialogue procedure, is the analysis processing function item for the test data. Two methods can enter this procedure: One is directly entering the human body dialogue according to preceding; Another is "open" way to enter, click on operating column "broken wire analysis" item (or click on tool column icon button) to enter the operating sequence, or click on “file" column "open" item, the inquiry window will pop, click on "analysis" item to enter the operating sequence.

Picture 11 Broken Wire Analysis Interface Picture
Broken wire analysis (man-machine dialogue) the surface introduction that:
- In the procedure window, center is the data wave form display picture, a screen altogether displays 16 lines, and each line altogether displays 512 sampling spots.
- Display window two sides numerals are both distance display: Left is this wave form corresponding testing starting location; Right is total this wave form corresponding testing displacement between the starting and ending location.
- Two page numbers under the display window: One is the total page number; the other is the current page number.
- There are several buttons in the middle of the two page numbers, when the total page number is not more than 1, there are two buttons, “Analyze automatic” and “Analyze artificial”, when the total page number is over 1, there will add one: “Next”. Click on “Analyze automatic”, the system will judge the red marked spot and calculate each partial flaw result according parameter that select (for example broken wire equivalent number or proportion of cross-sectional area to total cross-sectional area); Click on “Analyze artificial”, the system will mark all suspicious wave signal points, the points will be confirmed or removed by the experienced operator, the system will write up report according to judgment result. The two operations will only be aimed at the current page, must reselect operating mode after the page turning. “Next” mainly is used in turning the page, will only be able to turn one page to next page, the earlier pages will be not able to view before judging ending. Dragging the roll to scan the earlier pages will be allowed only after judging ending, but amending is not allowed.
- There a row display below the buttons, left side is the route and name of the file opened this time; the middle is the LMA0 value, this value is the reference value of cross-sectional areas automatically calculated by the system for this group of data, is on basis of the first row average of this data wave form. In calibrating process it just need to fill in cross-sectional area parameter column, the system will evaluate processing analyzing data the metallic cross-sectional area changing (for example deterioration) according the LMA0 value.
- When use artificial analysis, a group of VPP value appears in right and bottom, namely former crest to crest value and latter crest to crest value of this wave form partial abnormity signal in the location marked in red spot in display window. When use the automatic analysis, this value will not appear.
Broken wire analysis procedure as follows:
- Select a group of parameter to suit this evaluation, if there is no suitable one to be possible to add or amend, and confirm the selection to use.
- Enter the procedure according to the above operating procedure, a “Select data file” window will pop, and click on prepared analyzing processing data file, open to enter the procedure item.

Picture 12 Data Selection File Window
- The system will act according to the parameter logarithm which will elect according to carry on the automatic scan, when the partial flaw signal two crests values mean value will be bigger than first threshold value, will carry on the sign note to this place, and will give the sign note to this page all similar situations.
- Each point will be confirmed or removed by the experienced operator, and the slack strand, jumping wire, deformation and other flaws of the wire rope may be judged from the testing wave form. Pay attention to isosceles triangle whose two crests values the data difference is not big, and wave form crest is similar to acute angle. The concrete flaw characteristic and the evaluation detailed knowledge may be seen in the chapter 6, the flaws analysis and the evaluation.
- When the operator has no different opinion on the marked red spots in current page screen, and judge them broken wire, directly click on "Analyze automatic" button. All the marked red spots in this page will be confirmed for broken wire, the system will automatic calculate quantification value in each place, and display the value list in the result report. Click on "Next" button to turn page and operate again.
- When the operator has different opinion according to flaw signal on part of the marked red spots in current page screen, must reject the part, and will have to use artificial analysis evaluation procedure. Directly click on "Analyze automatic" button to enter the artificial analysis procedure. All red spot mark will be scanned one by one in the current page, when scanning to some a spot, the mark color will turn black, and its VPP will appear in right below, and a dialogue window will pop and inquire whether this mark is broken wire. If judge it broken wire, click on "Yes" in the window, and the marked spot will assume red; If it is not, reject it, then click on "No", the marked spot will assume yellow. Also may use the fast key to judge that, if confirm, press "Y" (or press the “Enter” key), if deny, press "N". When need continuously confirmation or denying, long press "Y" (press the “Enter” key) or "N" continuously similarly judge.
- When the operator has different opinion according to flaw signal on all the marked red spots in current page screen, all will give them all denying, long press "N" key. When this group of data have the multi- pages screen, may directly click on the next page to give the full page denying and to enter the next page of screen, so all the marked in this page will be denied, and no longer enter in the judging result, but last the page cannot so, only be able to long press "Y" or "N" according to the above method.
- After each page analysis ending, two buttons assume excessiveness.
- If the result report needs to be analyzed and evaluated this time, must when the analysis evaluation ends, immediately enter report column and click “broken wire report” item, open and view the result report.
- After assigning out data file, may continue to reselect data file that need analysis.
7. Deterioration analysis
The deterioration analysis (Ctrl+L) is evaluation procedure to the testing wire rope metallic cross-sectional area change (for example deterioration), is an automatic evaluation function item for the test data according to a datum value. Click on “Deterioration analysis” in operating column (or direct use fast key) to enter the operation sequence (As Picture 13).

Picture 13 Deterioration Analysis Interface Picture
Deterioration analysis interface introduction:
- When enter the procedure, a “deterioration warning threshold” window will pop (like Picture 14), input a positive number in the blank space according to each profession standard specification limiting value, or according to one’s own requirement. The procedure will rest on this value will calibrate the result according to metallic cross-sectional area reduce (for example deterioration). When the result surpasses this value, color of deterioration percentage in right surface will turn red. The wave form data result that assumes red will be recorded in the deterioration report.

Picture 14 Data Selection File Window
- In the procedure window, center is the data wave form display picture, a screen altogether displays 16 lines, and each line altogether displays 512 sampling spots.
- Display window two sides numerals are both distance display: Left is this wave form corresponding testing starting location; Right is the increasing or decreasing percentage of this wave form corresponding the metallic cross-sectional area datum value, namely LMA change percentage.
- There are several buttons in the middle of the two page numbers, when the total page number is not more than 1, there are two buttons, “Print current page” and “Printing OK”, when the total page number is over 1, there will add two: “Back” and “Next”. “Print current page” is that, regarding the current page graph, click on "the printing current page" button, regarding each current page in requirement, may click on this button; “Enter” is the button to confirm to print the page in requirement. Each A4 paper may print two screens, may print all the pages in waiting in turns. When just one screen need to be printed, may click on “Print current page” first, and click on “Enter”, the current page will be printed immediately. “Back” and “Next” is the function buttons that used in turning page.
- There a row display below the buttons, left side is the route and name of the file opened this time; in the middle it displays the cross-sectional area datum value, the system will evaluate processing analyzing data the metallic cross-sectional area changing (for example deterioration) according this value.
Deterioration analysis concrete sequence of operation as follows:
- Click on "Deterioration analysis" in operating column, "deterioration warning threshold" window will pop, according to one own requirement or each profession standard, input with a value in the blank space, and confirm.
- After inputting the parameter, a primary data folder will pop. Select the file that needs to be analyzed and open it.
- The surface will display this file data wave form, and display each position section corresponding metallic cross-sectional area changing. If the metallic cross-sectional area changing surpasses the supposing value, the number in right surface turn red reports to warn, this section corresponding wave form spot position, the conclusion position and the greatest value of this section reduction will be recorded in the report.
- Regarding each current page in requirement, may click on “Print current page”,When all the pages in requirement are selected, click on “Printing OK” and enter the printing procedure.
Attention: When click on the printing, in advance connect the printer and the computer, and set the printer which connects as default printer.
8. Report
The “Report” (Alt+B) contains broken wire report and deterioration report two function items, these two items are the display for analysis result.
8.1 Broken wire report
The "Broken wire report" (Ctrl+P) is the display for the primary data analysis result in the man-machine dialogue procedure, and is saved as the Word format.
Concrete operation as follows:
- When all analysis evaluation (man-machine dialogue) to some primary data “Broken wire analysis” procedure is finished, click on "Broken wire report" in report column.
- When open the report, a report format setting window will pop, and l set the report format selection (As Picture 15). This window contains two major terms: “File Selection” and “Result Option”. The “File Selection” contains “earlier result” and “newer result” two options, selecting “earlier result” means opening the analysis result at the time of the testing sampling , and selecting “newer result” means opening the current analysis result. “Result option” has “broken wire equivalent number” and “cross section percentage” two options, selecting “broken wire equivalent number” namely display the equivalent number of broken wires in broken wire report, and selecting “cross section percentage” namely display the percentage between cross section and the total sectional area in broken wire report. Just click on the circle in front of the choice, and confirm.
- After completing the choice and confirming, open the needed report immediately.
- This report might be saved in needed file according to the Word operating mode.
Attention: In broken wire analysis procedure, the broken wire report could be opened only after finishing all analysis in the page.
Broken wire report format introduction (As Picture 16): In the report crest it is the report name and category and the analysis evaluation time, under that it is the testing wire rope length, the wire rope diameter, the wire rope lay pitch, the testing wire rope length is testing wire rope total length. The below broken wire list, contains the serial number, broken wire position (m), broken wire number (root), accumulative total broken wire number in lay pitch (root). This report displays the localization, quantitative result, where broken wire is, and how many broken wire. When by percentage, report displays the serial number, broken wire position (m), and the cross-sectional area percentage (%).

The "Deterioration report" (Ctrl+T) is for display for the primary data analysis result according to the cross-sectional area datum value, and is saved as the Word format.8.2 Deterioration report
Concrete operation as follows:
- When all analysis evaluation (man-machine dialogue) to some primary data “Deterioration analysis” procedure is finished, click on "Deterioration report" in report column.
- This report might be saved in needed file according to the Word operating mode.
Attention: In the deterioration analysis procedure, report item can be opened only after browsing all pages, and the report only at this time is the complete analysis evaluation report.
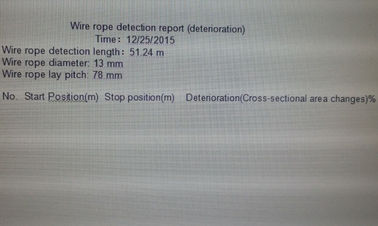
Deterioration report format introduction (As Picture 17): In the report crest it is the report name and category and the analysis evaluation time, under that it is the testing wire rope length, the wire rope diameter, the wire rope lay pitch. The below deterioration list, contains the serial number, the starting position (m), the ending position (m), deterioration quantity (%).This report displays the starting and ending points that each section of deterioration surpass the suppose value, and juxtaposes this section biggest deterioration quantity. If there are the continual deterioration surpassing the limit, it will display by list, and display where the deterioration is, how much deterioration quantity.

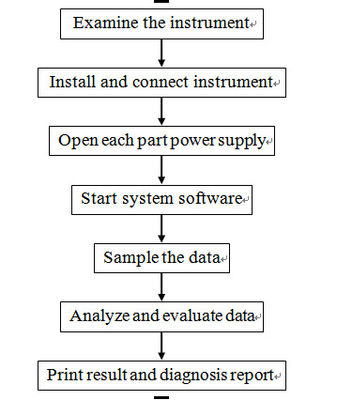
The system operation is on the principle of step-by-step, should be on the basis of familiar with the system. Only Grasping the instrument hardware connection and the installation elementary knowledge, familiar software method of application, can test and sample data; When data signal flaw analysis evaluation, it must be operated or directed by the experienced operator or the personnel who has the qualified qualifications after training. Concrete operation flow like Picture 18 shows:
9. System Operation Flow

10. Broken Wire Parameter Calibration
10.1 Broken wire number judging method
Testing software judges broken wire according to the following process. First, seek local anomaly signal in several hundred meters test signals (usually produced by broken wire); After found the signal which the fracture produces, this position broken wire number is obtained through the software computation, thus obtain broken wire position and broken wire number, broken wire position should be determined to space between jet, different broken wire out of a jet along the rope axial will be identified as different broken wire location, namely broken wire resolution is space between jet.
Saying from the signal processing method, the testing software that completes above operation is realized by using setting threshold. When there is signal more than First Threshold value in the test signal is the partial flaw, the First Threshold value mainly is broken wire recognition qualitative parameter, whether there is broken wire, if its value is too small, it will possibly appear judging more; Oversized will possibly appear leaking testing. The Second Threshold value is signal quantitative distinction parameter in that surpasses the First Threshold value, its size is mainly decided by the simple wire rope diameter, if its value is too big, the broken wire number will be judged less; too small, broken wire will be judged more.
Correctly setting “first Threshold value”, “second Threshold value” is the key to judge and analyze the test signal unmistakably. Therefore how to set “first Threshold value”, “second Threshold value”, the concrete method has two kinds: One is off-line calibration (most basic, most normative) and the other is on-line calibration.
10.2 Off-line calibration method
Take a new or old wire rope, which is same as the testing wire rope and its length not smaller than 2 meter, as the experiment. Put up and tense this wire rope, then simulate the standard broken wire, generally simulate one, two, three and several concentrate broken wire, test with the instrument. The concrete request may refer to American ASTM E1571-1996"Electromagnetic Method Testing Wire rope Standard Rule".
Like Picture 19 shows:

Picture 19 Calibration wire rope installation diagram
Install the detector set, set the known wire rope parameter in the "add parameter" function, like the diameter, the metallic cross-sectional area, the lay pitch, the sampling interval, the magnification rate of wave form (temporarily suppose may be 1), and set "First Threshold value" and "Second Threshold value" as smaller value. Enter "select parameter" function to select this parameter serial number. Enter the "sampling" function, draw the sensor to pass through the simulation broken wire position (to be possible back and forth movement), end testing, enter the analysis procedure.
Screen display testing wave form. When "First Threshold value" is bigger, the correspondence broken wire the signal will not be able to instruct that, now should return to calibration "First Threshold value" to change slightly, and then enter "Broken wire analysis". Assign out the test data filename, enter broken wire artificial analysis, and operate like following.
Broken wire recognition process, the software compares each crest signal, when it surpasses "First Threshold value", will mark it with three red spots. If it is not broken wire correspondence signal, then find next crest spot that surpass "First Threshold value", continue to operate until completing all broken wire signal marking.
Observe the group of values under the screen; the two values after the VPP are respectively the crest value. Set "First Threshold value" as about 85% of the smaller in two crest values. If "First Threshold value" is too small, non-broken wires signal will be marked. Observe the value above the screen, and broken wire signal amplitude changing between the background signals will be found, and "First Threshold value" will be set appropriately. Because the concentrate broken wires are 2, 3 or more, its corresponding signal amplitude is bigger than it corresponding 1. "First Threshold value" setting aims mainly at single broken wire.
After the "First Threshold value" setting, enter the historical data to judge broken wire, for the red marked signal spot, press the "Enter" to confirm, after the operation finishing, observe the testing result display, adjust the "Second Threshold value", make the testing result basically consistent with the broken wire. Set parameter and test continuously to obtain the best value.
Regarding wire rope which is composed by the many kinds of specifications wire rope, when judging broken wire must select suitable "Second Threshold value" to get the reasonable comparable quantitative result and the calculation result is displayed as the equivalent number at this time. When the wire rope rust is serious, the rust spot also will produce a bigger local anomaly signal, thus it would be possible to judge as broken wire signal.
10.3 How to set "First Threshold value"
On the computer man-machine dialogue surface, set "First Threshold value" with the purpose of marking the sampling data having one more broken wire with red spot for user distinguishing. If setting "First Threshold value" too big, then many broken wire flaw will be missed. Otherwise, the "First Threshold value" is too small, and then many normal (non-flaw) sampling on the wire rope also would be marked by the red spot, make the unnecessary trouble for the operator.
In order not to let broken wire flaw leave out, the "First Threshold value" should be slightly smaller than leakage magnetic signal computer outputting. Take Picture 20 for example, from compared experimental test data, we analyze according to the known broken wire position, broken wire spot "P" has one broken wire, the leakage magnetic signal computer outputting (VPP) respectively is 75 and 60, if the "First Threshold value" setting is bigger than 75, then broken wire spot "P" will not be marked, form leaking judgment. Therefore the "First Threshold value" should be slightly smaller than 60, usually, we set the D1 as about 85% of 60, it is 51 (the note: VPP is taken to broken wire place leakage magnetic computer outputting, and is usually taken a the smaller).
It is expressed by the followed formula:
First Threshold value=VPP×85%

Picture 20
10.4 How to set "Second Threshold value"
We test the wire rope broken wire with the purpose of quantitative judging. In the man-machine dialogue surface, the wire rope broken wire is initially recognized by "First Threshold value" and the operator confirms, broken wire position has been settled. And the broken wire quantitative duty will be completed by flaw analysis software. The broken wire quantitative error is decided by the "Second Threshold value" setting level.
It is well known, wire rope application is widespread, along with various professions operation requirement, various kinds of specification wire rope come out, and moreover the diameter specification changing is many. Big to more than 200mm bridge cables, slight to several mm logging wire ropes, they are all needed to test broken wire and the deterioration with the wire rope security testing instrument. One broken wire, because the structure, the rope diameter and the wire diameter are different and the broken wire form also are different, the broken wire leakage magnetic outputting is also different. If "Second Threshold value" setting dose not change along with it, then, the broken wire quantitative error will be very big. In other words, the structure is different, the rope diameter is different, "Second Threshold value" setting also should change along with it.

Picture 21
Therefore under premising condition, it should be better to first take one section same new wire rope and make some broken wire on it before testing some one wire rope, take the section as "Second Threshold value" calibration type rope. For example, in Picture 21, the expression is 2.5m length (6×37+IWSC) wire rope, A, B,C, D, E, F is the artificial setting broken wire spots, the broken wire respectively are 1, 2, 4, 5, 7, 6 (Generally broken wire spot is made with three, broken wire respectively are 1, 2, 3). Set willfully the "Second Threshold value" first, similar to operation testing in Section 5.2.2, if each spot error (Each place concentrate broken wire premising having ±1 root or ±1 equivalent root error) between testing broken wire number and actual broken wire number is in the technical specification permission scope, then may think the "Second Threshold value" setting conform to the requirement. Otherwise, then must reset "Second Threshold value". If testing broken wire number is bigger than actual broken wire number, the "Second Threshold value" must be brought up; the testing broken wire number is smaller than actual broken wire number, then "Second Threshold value" must be reduced. If needed, may adjust repeatedly until the error between testing broken wire number and actual broken wire number is in the technical specification permission scope. To this, we thought the "Second Threshold value" setting already completed.
10.5 "First Threshold" and "Second Threshold" on-line calibration
Regarding the service wire rope that has had broken wire, find broken wire position, install the sensor, move the sensor to test a group of signals, and operate like Section 5.5.2.1, get the "First Threshold Value".
Set the "Second Threshold value" as the same as the "First Threshold value", make the entire journey testing, if the judgment is 2 or more roots broken wire, find this position, and test to confirm the "Second Threshold value".
10.6 Wave Form Reduce Rate Setting
The "wave form reduce rate" is the testing magnification rate of wave form or reduce, in order to the testing direct-viewing judgment convenience, usually set it as 4~6. The bigger the number is, the smaller the wave form. Otherwise, the wave form is bigger.
10.7 Related Deterioration Parameters Calibration (LMA)
The wire rope deterioration (metallic cross-sectional area changing) main parameter are the metallic cross-sectional area, the cross-sectional sensitivity and the cross-sectional datum value, how to correctly set this parameter, will directly affect the instrument computation accuracy on the wire rope deterioration.
10.7.1 Cross-sectional sensitivity setting (on-line and off-line)
The cross-sectional sensitivity is the computer outputting variance which the wire rope unit cross-sectional area changing causes. Because many factors such as the component performance discreteness and the sensor production technology etc, cross-sectional sensitivity of every sensor are various, this parameter calibration is given by the factory.
10.7.1.1 Cross-sectional sensitivity on-line calibration
Install the sensor on the service wire rope, choose correspondence parameter serial number, enter the on-line testing, let the sensor be motionless, round the guide roller more than 6 circles(equal with sensor moving above 1m), end the testing, enter the wave form analysis, at this time on the screen there are possibly only datum line (dashed line)but no signal wave form, this mainly caused by the unsuitable cross-sectional area datum setting, and is not important, so long as pay attention to LMAO upper left screen, record it as Manrope; Turn on the sensor to clamp a wire whose material is same as wire rope in among, as Picture 22 shows, suppose cross-sectional area as Awire, install the wire and the wire rope together in the sensor, test again according to the spoken of earlier, get another LMAO, record it as Matest. Then the cross-sectional sensitivity α is defined by:
α= (Matest - MArope)/Awire
Duplicate several times of above operations; remove the operating or accidental error, desire average to obtain a more accurate α. α may be positive or negative, when the testing metallic cross-sectional area increases, the LMAO increases along with it, α is positive; Otherwise α is negative. Because of magnetic field changing, different sensor testing different specification wire rope, α size and mark can change

Picture 22 On-line sensitivity calibration Picture
10.7.1.2 Cross-sectional sensitivity off-line calibration
Use a section wire rope whose specification is same as the testing wire rope to measure α, install like broken wire parameter testing, what is different, the wire rope length must be bigger than 5m, install the sensor in the middle of the wire rope to remove the ends effects. As Picture 23 shows, other operations are same with on-line determination.

Picture 23 Off-line sensitivity calibration Picture
10.7.2 Cross-sectional datum value setting
When using the magnetism measuring technique measure wire rope metallic cross-sectional area, the sensor only can assume the linear variation in some measure scope, therefore, to some specification sensor; it only can work in wire rope cross-sectional area changes smaller scope.
Picture 24 is model outputting characteristic curve when the sensor measures metallic cross-sectional area. When want to measure some wire rope metallic cross-sectional area absolute value, must in the known some metallic cross-sectional area MAo range of linearity correspond sensor outputting signal Vo, then can through the sensor signal VT, calculate is testing wire rope metallic cross-sectional area MAROPE
MAROPE= Mao+(VT-Vo)/α
When the MAROPE and the VT corresponding relations cannot be determined, can only determine the cross-sectional area relative variable ΔMAROPE
ΔMAROPE+(VT-Vo)/α
Therefore, the wire rope metallic cross-sectional area measure divides into the absolute cross-sectional area measure and the relative cross-sectional area measure.

Picture 24
If want to know the wire rope cross-sectional area deterioration, must know the wire rope cross-sectional area when it is not fray, and then can obtain the wire rope cross-sectional area relative deterioration rate. In the parameter column, after the wire rope metallic cross-sectional area inputting, the cross-sectional datum value is the metallic cross-sectional area computer outputting.10.7.2.1 Cross-sectional datum value setting significance
10.7.2.2 How to set the cross-sectional datum value
The cross-sectional datum value is outputted by the processing software computation. The concrete operation is as follows, may first input the free value in cross-sectional datum value column when the parameter calibration, then test the non-deterioration wire rope, in wave form analysis surface (for example Picture 25) "LMA0 = 1,949" displays LMA0 on the left, the value will be this wire rope cross-sectional datum value, input it in the cross-sectional datum value column, thus, this parameter calibration has been completed. (Attention: The first line of wave form must be orderly.)

Picture 25 Testing wave form Picture
10.7.2.3 Absolute cross-sectional area measuring
Same as the cross-sectional sensitivity off-line calibration, take a section of new wire rope that is 5m long, only need move 5m in the rope central, obtain a group of test data, read the LMAO value in the wave form analysis. This LMAO value is the new wire rope metallic cross-sectional area correspondence outputting signal value. Operate repeatedly to get the average, and obtain the accurate cross-sectional area datum value.
Set this value in the testing parameter, and set the wire rope metallic cross-sectional area as the new wire rope cross-sectional area, test when the service wire rope with this bunching parameter, in the wave form analysis, may obtain each section of wire rope absolute cross-sectional area according to the cross-sectional area changing rate (LMA %) relative to the new rope.
10.7.2.4 Relative cross-sectional area measuring
When there is no new wire rope used in calibration for a while, may choose the place that had least deterioration and rust on the wire rope to regard as testing cross-sectional area datum. Because this place genuine cross-sectional area is unknown, and the metallic cross-sectional area must be the new wire rope cross-sectional area, there is some error in testing.
Usually see the 1m long wire rope from the testing starting place as parameter calibration section, this section of corresponding outputting signal is displayed in wave form analysis screen upper left, namely LMAO value. Set the cross-sectional area datum value as this value, set the metallic cross-sectional area as the new wire rope cross-sectional area, after that, all testing wire rope metallic cross-sectional area relative changing come from the comparison with this place.
11. Flaw Analysis Evaluation
11.1 Goal and Significance
In order to make the hugeness series wire rope harmless flaw detector user use this product better, the company provides to hugeness users the experience that is accumulated from many years the series wire rope testing instrument development, experiment, testing and the application. And take the wave form as the example, for hugeness user reference, in order to get correct diagnosis report for the wire rope.
The series harmless flaw detector full name is the series artificial assistance computer intelligence judgment harmless flaw detector. The so-called artificial assistance refers to the artificial broken wire, deterioration and tarnishing qualitative distinction, the computer intelligence judgment refers to the computer quantitative evaluation on the foundation of qualitative. For example: a section of wave form, operate according to the software as a matter of experience, we judge broken wire (call it artificial assistance), after the judgment finishing, the computer automatically tell us the position and number of the broken wire that we judge, the number in lay pitch (call it computer intelligence judgment).
This chapter will make the system explanation on each kind of wave forms which will meet in the real-time testing process. Analyze wave form producing reason, the wire rope material and structure influence which brings to the wave form analysis. Simultaneously we sincerely welcome the user to inform us unusual signal and the difficult problem that you meet in the practical work by sending teletext, and we analyze the reason and solute the difficulty question together.
Because of the level limiting, the mistake is unavoidable. The wire rope harmless flaw testing technology originally is a new course of study, in order to unceasingly raise our own level, earnestly hope user fix the blame with mistake in this handbook, and welcome correction, we will feel grateful.
11.2 Fire Rope Flaw
Along with period of revolution continuing, the wire rope will be able to appear each kind of damage phenomenon. For example, the wire rope deterioration and tarnishing cause wire rope cross-sectional area reducing; weary, surface hardens and tarnishing cause the wire rope interior performance changing; misapplication causes rope distortion and so on. The service wire rope possibly appears damage such as single wire breaking, corrosion, deterioration, chaotic line etc, and all damage will be able to create the wire rope breakdown. Because of the wire rope using importance and wire rope structure performance characteristic, just one place of the wire rope appears the serious flaw, the whole wire rope will be scrapped. Therefore, once the wire rope appears breakdown, it will not be repaired.
11.3 Signal Division
The HUATEC HRD-100 series wire rope testing instrument is one kind of harmless flaw testing products that base on leakage magnetic principle, therefore the signal that appears in flaw position, we may understand it as leakage magnetic signal, analyze the signal which the wire rope produces from this angle, it will not to be difficult to understand. We may divide the test signal into two kinds in general: background signal and flaw signal.
11.3.1 Background signal
This kind of signal is the "jet wave signal" that is produced by the wire rope own structure, theoretically we call it background signal. Through processing method for example difference and overlay etc among various parts test signal, and the advanced gathering magnetism technology, the series testing system effectively eliminates the negative influence which the "jet wave signal" brings, and enhances the testing instrument Signal-to-Noise. The stray field in wire rope jet is a rule, cyclical distribution spatial field, therefore this kind of signal relatively even, is easy to distinguish. In addition, the "jet wave signal” reflects wire rope structure characteristic, simultaneously also reflects some condition such as the wire rope surface deterioration, tarnishing etc. We will illustrate it with some examples which have met in work.
11.3.1.1 Normal "jet wave signal":

Picture 27 Balance rope partial testing wave form Picture
Analyze as follows: May see from the above signal, the wire rope structure condition is good, has no broken wire, has no partial deterioration, has no tarnishing phenomenon, the structure is twisted strictly, the material quality is better.

Picture 28 Gantry crane partial testing wave form Picture
Analyze as follows: May see from the above signal, the wire rope structure condition is good, has no broken wire, has no partial deterioration, has no tarnishing phenomenon, but the structure is no twisted well, the material quality is better.

Picture 29 Rope way traction rope partial testing wave form Picture
Analyze as follows: May see from the above signal, the wire rope structure condition is not good, has no broken wire, has no partial deterioration, has no tarnishing phenomenon, but the structure is twisted worse than the above two kinds, the material purity is not high, it is decided by the wire rope processing technology.
11.3.1.2 Wire Rope "jet wave signal" when deterioration phenomena:

Picture 30 Tower crane partial testing wave form Picture
Analyze as follows: May see from the above signal, the wire rope structure has had a bigger change in the use process, the wave form fluctuation in the picture shows that the jet wave leakage magnetic is non-uniformity. In leakage magnetic more place, wave form is upward and behave as the deterioration or the tarnishing; In leakage magnetic less, wave form moves downward relative datum line and behave as the wire rope partial cross-sectional area increasing (for example: When slack strand). This kind of "jet wave signal" production often brings certain difficulty in broken wire qualitative distinction.
Note: The datum line refers to the dashed line in the picture.
11.3.1.3 Wire Rope "jet wave signal" when it has remanence in

Picture 31 Tower crane in ports
Analyze as follows:
“ ” This kind of letter is called the unwanted signal, is caused by the wire rope interior containing the magnetism. The reason for having the magnetic may divide into two kinds, one kind is wire rope being struck by lightning, and the other kind is the production technology. When meeting this kind of signal, should degauss the rope first then to test, or test many times with the instrument.
11.3.1.4 Wire rope terminal nose effect

Picture 32 Tower crane in ports
Analyze as follows:
 |
This kind of letter is called ends effect, appears in the wire rope testing starting end and the termination end, is formed by testing starting sudden changes, and cannot be processed as the flaw signal. |
11.3.2 Broken wire signal analyzing method
The wire rope broken wire generally be divided into: wearily broken wire, deterioration broken wire, tarnishing broken wire, cutting broken wire, overload broken wire, twisting broken wire and so on. Because the wire rope usually is composed by same diameter many root wires or different diameter many kinds of specifications wires, the surface is often rugged, the interior has the air clearance, is not the ferromagnetic material continual body. Therefore, when the wire rope is magnetized, in its superficial stray field, both has the broken wire stray field, and the background stray field (jet wave signal), brings the certain difficulty for us in the flaw qualitative.
11.3.2.1 Parameter adjustment method
Different structure wire ropes have different parameters. Correctly and reasonably choose parameter, may enable us to get twice the result with half the effort in the judgment process. (Each parameter definition seen in instruction).Magnification rate of wave form adjustment especially is important in them, this parameter is convenience to see the picture for the operator when judging, its parameter may be adjusted according to need.
Take a wave form below as the example:

Picture 33 Current Magnification rate of wave form: 6
May see from Picture 33, the flaw signal increases recognition difficulty under the jet wave signal disturbance, and is very difficult to identify. In the situation we can effectively reduce this kind of difficulty through the adjusting magnification rate of wave form, as the following Picture 34 shows:

Picture 34 Current Magnification rate of wave form: 2
Note: The magnification rate of wave form merely is used for the wave form size zooming, may enhance the Signal-to-Noise through the effective adjustment, reduce the difficulty to distinguish the flaw signal, has nothing to do with signal own withdrawing, the degree of regulation is convenience for is suitable to distinguish and analyze.
11.3.2.2 Crest values comparison method
Crest values comparison method, this kind of method is generally used in the condition of low Signal-to-Noise. Because of the wire rope structure different, wire rope diameter is also different. Therefore to different structure wire rope, one broken wire leakage magnetic is not same. In principle, the leakage magnetic that the thick wire rope broken wire is more than thin one, therefore the signal it produces would be big. In view of the thin wire rope broken wire, we may take comparison according to the signal characteristic and crest value, in threshold value has been adjusted situation.
As following Picture 35:

Picture 35 Marked position VPP: 41, 29 (background signal VPP)

Picture 36 Marked position VPP: 55, 55
May compare from this to obtain leakage magnetic produced in this two points is bigger than the marked position in Picture 35, two crest values data disparities equal, and the characteristic signal is obvious, namely the wave form crest is similar to the acute angle isosceles triangle, therefore we may determine it as broken wire signal.

Picture 37 Special broken wire signals (Yuyang Coalmine hoisting rope)
This is the broken wire signal picture, space between two ends spacing is quite big, they have formed "M", can be judged as broke wire, besides be continuum broken wire.
The situation above is the common difficulty that will be met when we use the series wire rope testing instrument, to want the skilled utilization and grasp, it needs us to accumulate experience in the routine work, so can digest it.
11.4 Wire Rope Diameter Evaluation
In wire rope computer testing diagnosis system, wire rope diameter evaluation is through LMA testing signal to indirectly determine. Because the wire rope internal and external deterioration and tarnishing will reflect on the metallic cross-sectional area change, when the tarnishing is slight, wire rope diameter could be calculated by the cross-sectional area change.
For example, when wire rope outer layer wires are wear out to 2/3, the 6×19 wire rope metallic cross-sectional area will reduce by 1.54%, the 6×7 wire rope metallic cross-sectional area will reduce by 4.19%, and other structural wire rope metallic cross-sectional area reduction will be obtained through calculation.
11.5 Wire Rope Tarnishing Evaluation
Judging from the current domestic and international study of the status quo, the wire rope tarnishing evaluation had not had the appropriate method. But the wire rope tarnishing could be reflected through the cross-sectional area testing signal, when serious could be reflected through broken wire testing signal.
12. Wire rope assurance coefficient
| Wire rope assurance coefficient |
When it is within a pitch existing following broken wire rope number the wire rope must be discarded as useless promptly |
| The abrasion loss or corrosion of wire rope surface attain the percentage (%) of the original wire rope diameter |
| 0 |
10% |
15% |
20% |
25 |
30% |
| 0—10 |
16 |
13 |
12 |
11 |
9 |
8 |
| 10—12 |
18 |
15 |
13 |
12 |
10 |
9 |
| 12—14 |
20 |
17 |
15 |
14 |
12 |
10 |
| 14—16 |
22 |
18 |
16 |
15 |
13 |
11 |
| Annotation:The broken wire number in the form, reporting as unserviceable wire ropes are based on Lange lay wire rope with 1/2 mathematical value |
13. Sensor option
| Sensor |
Diameter of wire rope |
Best detection range |
| HUATEC-F5 |
≤5mm |
2~5mm |
| HUATEC-F10 |
≤10mm |
5~10mm |
| HUATEC-F15 |
≤15mm |
8~15mm |
| HUATEC-F20 |
≤20mm |
10~20mm |
| HUATEC-F25 |
≤25mm |
15~25mm |
| HUATEC-F30 |
≤30mm |
20~30mm |
| HUATEC-F35 |
≤35mm |
15~35mm |
| HUATEC-F40 |
≤40mm |
30~40mm |
| HUATEC-S45 |
≤45mm |
35~45mm |
| Other sensor can be customized production |

 Your message must be between 20-3,000 characters!
 Please check your E-mail!
  Your message must be between 20-3,000 characters!
 Please check your E-mail!
